
Podcast charts are popularity rankings built from recent listener activity, not lifetime totals. Platforms rank a show by measuring things like new subscriptions, unique listeners per episode, plays, watch time and completion rate over a rolling window of days or weeks, then they slice those numbers by country and category.
That is the honest short answer. The part most articles get wrong is the detail: no platform publishes its exact formula, so anyone who tells you they know the precise weighting is guessing. What we can do is separate what each platform publicly shows you from what podcasters have measured over time.
Last updated October 2026. Most page-one results on this topic are still news posts from 2018 to 2021, so a fair amount of what you read is out of date.
Table of Contents
- How Podcast Charts Are Calculated: What the Rankings Mean
- Podcast Chart Metrics at a Glance
- Which Data Do Major Podcast Platforms Use?
- How Are Downloads and Unique Listeners Different?
- Do Ratings, Followers and Social Shares Affect Podcast Charts?
- How Are New and Trending Podcasts Identified?
- Why Can the Same Podcast Appear on Different Charts?
- Can a Podcast Chart Be Manipulated?
- A Simplified Example of a Podcast Ranking Formula
- Frequently Asked Questions
- Is there one formula used to calculate every podcast chart?
- Are podcast downloads the same as unique listeners?
- How often do podcast chart rankings update?
- Does getting more five-star ratings automatically improve chart rank?
- Can paid podcast promotion affect chart position?
- Does appearing on a podcast chart guarantee more listeners?
- Conclusion: Start with Recent Listening Growth
How Podcast Charts Are Calculated: What the Rankings Mean
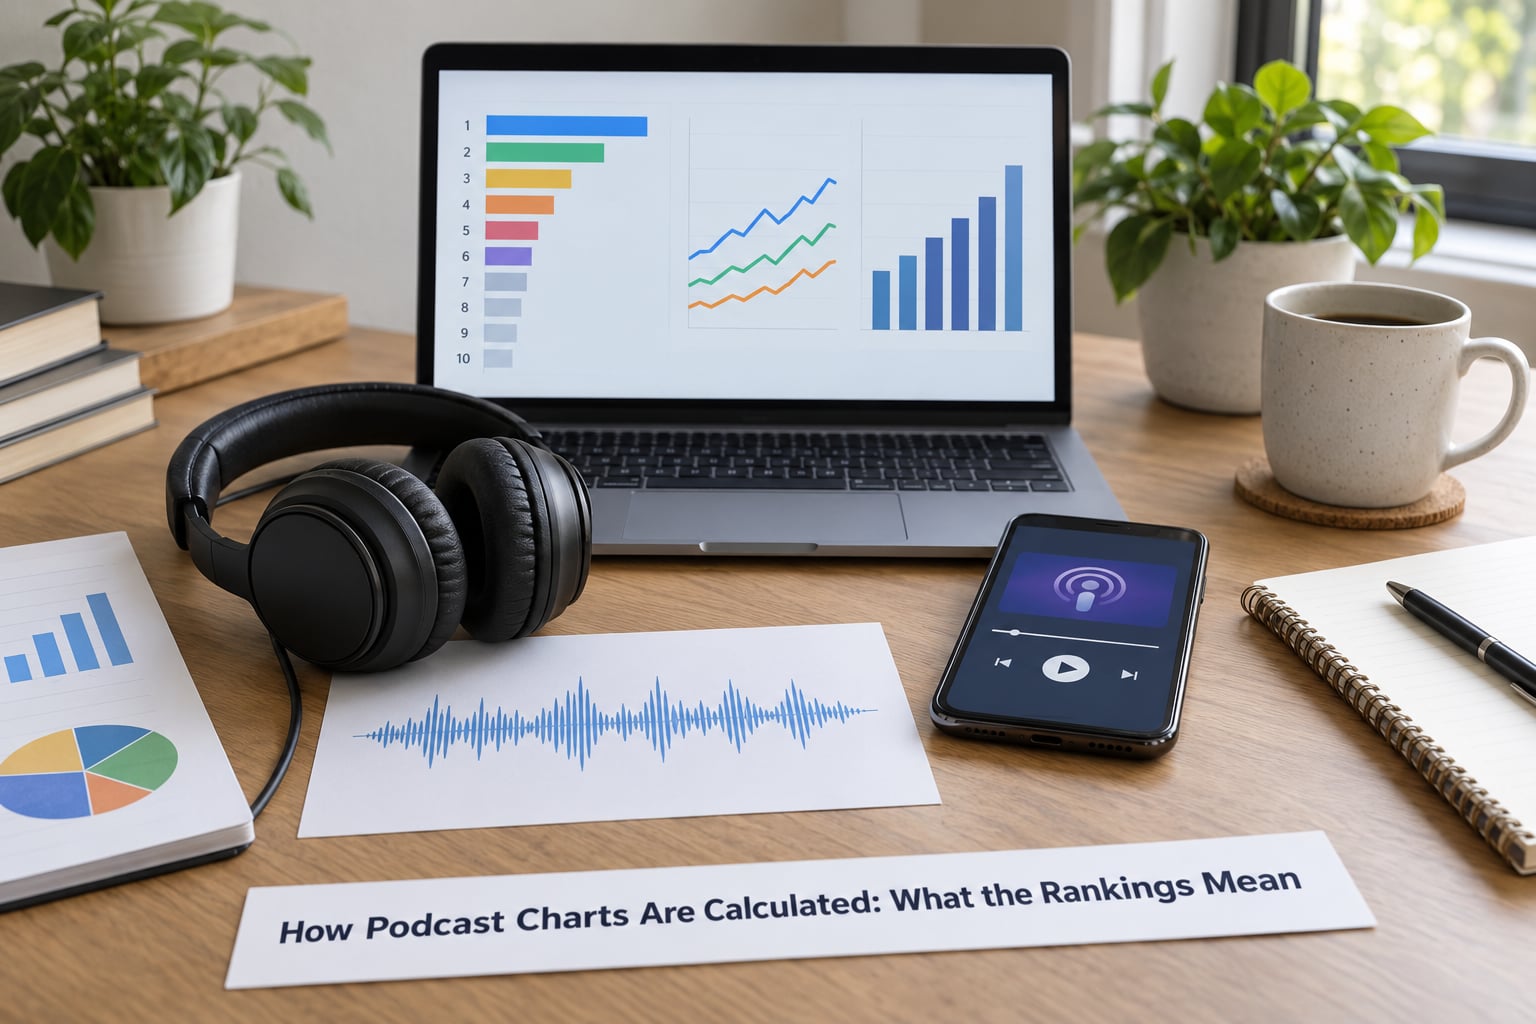
A ranked chart and an editorial list are two different things, and mixing them up causes most of the confusion on this topic. A ranked chart is a live leaderboard sorted by measured activity. An editorial list is chosen by people, the way a magazine picks a “best of” feature.
When podcasters talk about how podcast charts are calculated, they almost always mean the ranked leaderboards in Apple Podcasts, Spotify and YouTube Music. Those are the ones that move on their own overnight without anyone asking them to.
Every ranked chart draws from the same small family of signals, weighted differently by each service:
- New subscriptions or follows in the last few days
- Unique listeners per episode, with duplicates removed
- Total plays, starts or streams per episode
- Completion rate, meaning how much of an episode people actually finish
- Watch time or total listening hours
- Velocity, meaning how fast a number is growing rather than how big it already is
That last one matters more than most listeners realise. A show with 200,000 listeners that added 900 people this week is a slower riser than a show with 20,000 listeners that added 3,000 this week. Charts exist partly to surface the second show.
Podcast Chart Metrics at a Glance
This table is the quickest way to understand why two charts disagree. Each input measures something different, and each has a limitation that can distort the picture.
| Chart input | What it measures | Main limitation |
|---|---|---|
| Downloads | Times an episode file was retrieved by an app | Auto-download on Wi-Fi inflates this without any listening |
| Unique listeners | Distinct people who played an episode, de-duplicated | Hard to verify outside a single platform’s own data |
| Plays or streams | A playback started, sometimes counted on play rather than listen | Starting an episode and hearing it are different events |
| Completion rate | Share of listeners who reach the end | Penalises long episodes even when retention is healthy |
| Watch time | Total hours consumed, popular on video platforms | Rewards length over repeat listening |
| Followers | People who subscribed to the show | Shows once, inflates on giveaways and cross-promos |
| Star ratings and reviews | Average score and written feedback | Very few listeners bother, and ratings are easy to game |
| Freshness | How recently the show released an episode | Weekly shows get a structural edge over seasonal ones |
| Paid promotion | Plays driven by advertising or a sponsorship push | Legitimate when disclosed, misleading when it is not |
Nothing in that list is a lie on its own. The problem is that a single headline number can hide all of it at once, which is why chart position is a weak stand-in for quality.
Which Data Do Major Podcast Platforms Use?
The three big services rank on overlapping signals with different names, different windows and different levels of disclosure. Here is the side-by-side view that most comparison guides skip.
| Platform | Primary chart input | Refresh | What the chart rewards |
|---|---|---|---|
| Apple Podcasts | Subscriptions, playback and engagement trends | Daily | Consistent release schedule and steady subscription growth |
| Spotify | Unique listeners per episode plus follower count | Daily, with separate show and episode charts | Rapid listener growth and episode-level streaming volume |
| YouTube Music | Streams, watch time and listener activity | Frequent, trending lists run on their own cycle | Long sessions and strong browse and search discovery |
| Amazon Music | Consumption within the Amazon ecosystem | Periodic | Plays from Alexa and Amazon Music users |
| Pocket Casts | Listening activity inside the app | Periodic | App engagement rather than open-web listening |
| Public-radio chart services | Downloads verified by prefix files such as OP3 and Podtrac | Weekly | Verified measurement over self-reported numbers |
Spotify’s approach is the most publicly documented because the service announced a change to it. Before 2021 the top podcasts chart leaned on streaming numbers and follower count, and Spotify moved its charts to a standalone site at the same time. Podcasters on r/podcasting still quote older advice from before that switch, which is worth knowing when you read a guide.
What Data Does Apple Podcasts Use to Rank Podcasts?
Apple does not publish its ranking formula. What is visible to creators in Apple Podcasts Connect is the pattern: new subscriptions, plays and engagement trends over a recent window, filtered for automated and suspicious activity. Charts are scoped by country and by genre, and the top charts refresh roughly every day.
The important gap is what Apple does not tell you. Whether completion rate carries more or less weight than raw subscription growth is not public information, and anyone who states a specific weighting as fact is repeating another podcaster’s guess. What you can rely on is that Apple removes traffic it identifies as automated, which is why a sudden spike followed by a sharp fall is a well-known pattern rather than a coincidence.
What Data Does Spotify Use for Podcast Rankings?
Spotify’s stated ingredients are unique listeners per episode and follower count, published as separate show charts and episode charts. Consumption behaviour inside the app, including how often listeners start and continue an episode, feeds the ranking. The exact formula and the thresholds for appearing at all are not public.
Follower count deserves a caveat. Followers are easy to move in ways listeners are not, particularly through cross-promotion, guest swaps and follow-for-follow behaviour. Treat a follower jump without a matching jump in unique listeners as a weak signal.
How Are Downloads and Unique Listeners Different?
A download is an event: the episode file was fetched. A unique listener is a person: one deduplicated human who played the episode. Podcasters have long argued that a meaningful share of downloads never get played at all, with automatic background downloads on Wi-Fi doing a lot of the counting, and one commonly cited industry figure puts that unused share at around 13%.
Worked example. Two shows both release an episode on Monday.
Show A records 9,000 downloads and 5,000 unique listeners with an 80% completion rate. Show B records 4,000 downloads and 3,800 unique listeners with a 45% completion rate. On a download-led chart, Show A wins comfortably. On a listener-and-engagement chart, the gap is far narrower, and on a completion-weighted chart Show B can take the lead.
This is the single most common reason a show climbs on one chart while sliding on another during the same release week. Neither number is wrong. They answer different questions.
Do Ratings, Followers and Social Shares Affect Podcast Charts?
Some of these are direct inputs, some are indirect, and podcasters often blur the line. Followers count directly on Spotify’s published charts. Star ratings and review counts are not usually listed as a headline ranking signal on the major ranked charts, though engagement trends sit alongside consumption data in Apple’s model.
Ratings matter more as a quality read than a ranking lever. A show with a 4.9 average across a large number of ratings is telling you something useful about audience satisfaction, and that number is drawn from real listeners rather than a vendor panel.
Social shares and link clicks are more ambiguous again. A burst of posts about one episode produces short-lived listening, not durable growth, and the main platforms are known to discount patterns that spike and vanish. Sustained conversation matters more than a single loud day.
How Are New and Trending Podcasts Identified?
Trending lists solve a specific problem: a leaderboard sorted purely by total size is unchangeable, because the biggest shows stay the biggest. So charts use a short window, usually days rather than months, and compare growth against a show’s own recent baseline.
That baseline matters for new shows too. A show with no history is measured on relative growth, which is why a debut episode can appear on a trending list and then drop off without anything being wrong. Chart eligibility also requires a minimum amount of measurable activity, so very small shows stay invisible no matter how good they are.
Release schedule is the quiet lever. A show that publishes on the same weekday every week builds a predictable listening pattern, and predictable patterns score well against the window most charts measure. Seasonal or event-driven shows are structurally disadvantaged in a rolling window.
Why Can the Same Podcast Appear on Different Charts?
Geography is the first answer, and it surprises new podcasters constantly. Charts are country-scoped, so a show can sit at number 50 in one territory and miss the chart entirely in another. Old Chartable users used to get daily emails about a show’s rank in a single country and category in places as scattered as the United Arab Emirates.
The rest comes down to measurement. Different windows, different deduplication rules, different filtering of automated traffic, and reporting delays of a day or more between what a creator sees in their dashboard and what the public chart shows. Add paid campaigns, which can lift one platform’s numbers without touching another, and the disagreements start to make sense.
Finally, some of the lists people call charts are editorial. A “best podcasts of the year” page is chosen by a publication, not sorted by a formula, and can crown a show the download data would not have put near the top.
Can a Podcast Chart Be Manipulated?
Legitimate promotion and artificial activity look different, and the difference is mostly disclosure and shape. Buying a legitimate sponsorship slot that mentions your show, or running an ad for a launch episode, moves real people to a real feed. Click farms and automated play services generate numbers without an audience behind them.
Warning signs are recognisable once you know them. A sharp spike in downloads that is not matched by unique listeners. A burst of followers arriving in a single afternoon. A chart position that jumps dozens of places and then evaporates within a week. Downloads concentrated in one country the show has never advertised in.
Platforms filter this traffic, and they remove rankings when they catch it, which is why a suspiciously good week often gets reversed. Reports going back to 2018 documented exactly this pattern on Apple’s charts, and nothing since has changed the underlying mechanics.
A Simplified Example of a Podcast Ranking Formula
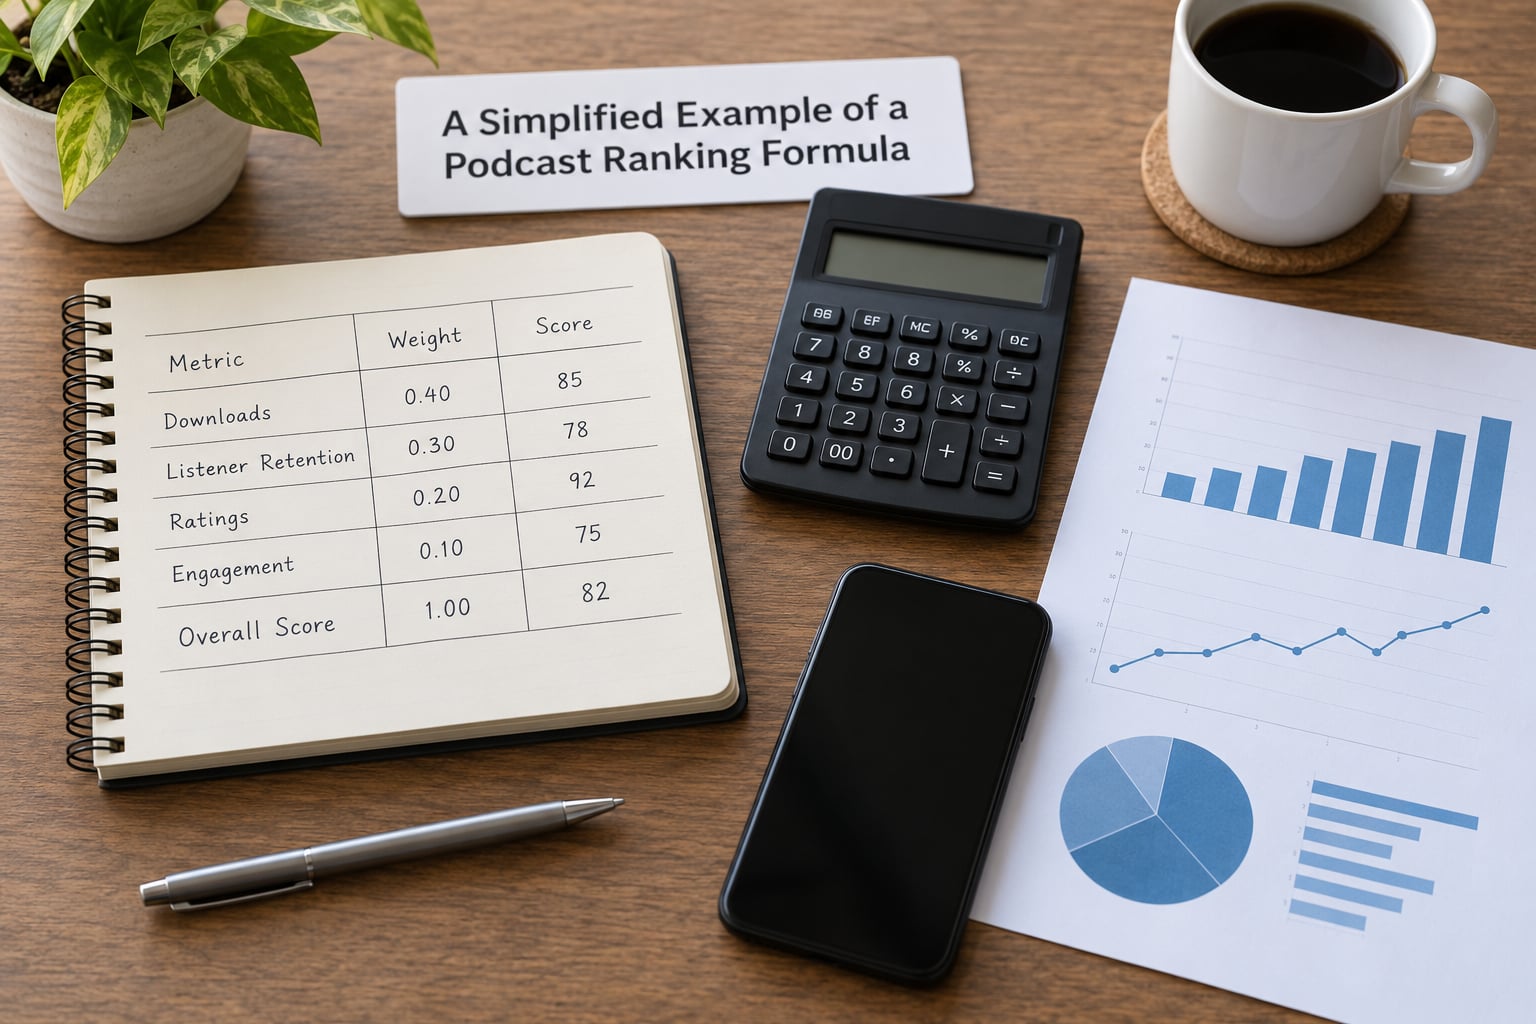
No real formula is public, so here is a transparent one built from the five inputs that show up most often. It is a teaching model, not a claim about any platform.
- Recent unique listeners, weighted 40%
- Week-on-week growth rate, weighted 25%
- Completion rate, weighted 15%
- Follower or subscription growth, weighted 15%
- Freshness, weighted 5%
Two shows, scored. Show A has 5,000 recent unique listeners with flat growth, 80% completion and steady follows. Show B has 2,000 recent unique listeners but 60% week-on-week growth, 65% completion and a fast-rising subscriber count. Show A wins on size, Show B wins on momentum, and a chart that leans hard on growth puts B ahead.
The weights above are a guess at the shape of the problem, and they shift the answer completely. Double the completion weight and Show A pulls clear. Drop freshness to zero and a show on a strict weekly schedule gains nothing for being reliable.
That sensitivity is the real lesson. Small changes in weighting produce large changes in ranking, which is why identical numbers can produce two different leaderboards, and why nobody outside the platforms can tell you exactly why a show sits at number 34 instead of number 36.
Frequently Asked Questions
Is there one formula used to calculate every podcast chart?
No. Apple, Spotify, YouTube Music, Amazon Music and third-party verification services each use their own combination of recent consumption, engagement and trend data. Apple does not publish its weighting, Spotify has publicly described unique listeners per episode plus follower count, and video platforms lean on watch time. Treat any single formula as an approximation rather than a specification.
Are podcast downloads the same as unique listeners?
No. A download counts the event of retrieving an episode file, and automatic background downloads inflate it without anyone listening. A unique listener counts deduplicated people who actually played the episode. Podcasters often cite around 13% of downloads as never played. Charts that rank on downloads will therefore disagree with charts that rank on unique listeners during the same week.
How often do podcast chart rankings update?
Apple and Spotify refresh their main charts roughly daily, which is the figure most podcasters plan around. Trending and fast-rising lists run on their own shorter or separate cycle. Third-party verification services such as OP3 and Podtrac typically publish weekly. Reporting delays of a day or more mean a creator dashboard and the public chart can briefly disagree.
Does getting more five-star ratings automatically improve chart rank?
Not automatically. Star ratings are not a headline ranking input on most major ranked charts, where consumption and subscription trends dominate. Ratings still matter as a signal of audience satisfaction for potential listeners and for sponsors reading a pitch deck. A high average across many real ratings is useful evidence; a sudden burst from new accounts is not.
Can paid podcast promotion affect chart position?
Yes. Advertising, cross-promotion and paid placements can drive real listeners to a show and lift its numbers on whichever platform receives that traffic. The effect is usually short-lived unless the promotion brings genuine new subscribers who keep listening. Campaigns aimed at inflating downloads rather than attracting listeners are filtered and can lead to a ranking being removed.
Does appearing on a podcast chart guarantee more listeners?
No, though it usually brings some. Chart placement raises visibility in browse surfaces and makes a show easier to pitch, which tends to compound. Rank is a snapshot of recent activity in one country and category, not a quality score. A show can chart briefly and still fail to convert that attention into a durable audience.
Conclusion: Start with Recent Listening Growth
The takeaway is small. Podcast charts rank recent listening activity, not all-time popularity, and every platform weights the signals differently without publishing the formula.
Before trusting a chart position, look at what it actually measures: recent unique listeners rather than raw downloads, one country and category rather than the global picture, and growth over a fixed window rather than a cumulative total. Compare a show’s recent episode performance across two or three relevant charts instead of treating a single rank as a verdict on quality.