
If you have ever wondered why a song is number one on the radio and a different song is number one on the streaming chart, you are looking at two systems that count completely different things. Understanding how airplay charts are compiled means following one play of one song, from the moment it leaves a studio transmitter to the moment a chart manager’s office publishes a rank on Monday morning.
This guide walks the whole chain end to end, including a worked example of how raw spins become a chart position, how stations report what they play, and where sales and streaming data enter the picture. It was reviewed for accuracy in 2026.
Table of Contents
- How Airplay Charts Are Compiled
- What Counts as an Airplay?
- How Stations Report What They Play: Pattern Matching and Logs
- How Airplay Charts Are Compiled From Monitoring Data: Eight Steps
- How Broadcast and Digital Listening Are Combined
- Why Market, Format, and Time Period Matter
- Where Sales and Streaming Data Fit
- What Can—and Cannot—Change a Chart Position
- Frequently Asked Questions
- What is the difference between airplay and a chart ranking?
- How often are US radio airplay charts updated?
- Why do local and national airplay charts show different results?
- Does heavy radio rotation guarantee a song will rank highly?
- Can a song have more spins but a lower chart position?
- How do chart companies verify that stations reported accurately?
- Conclusion
How Airplay Charts Are Compiled
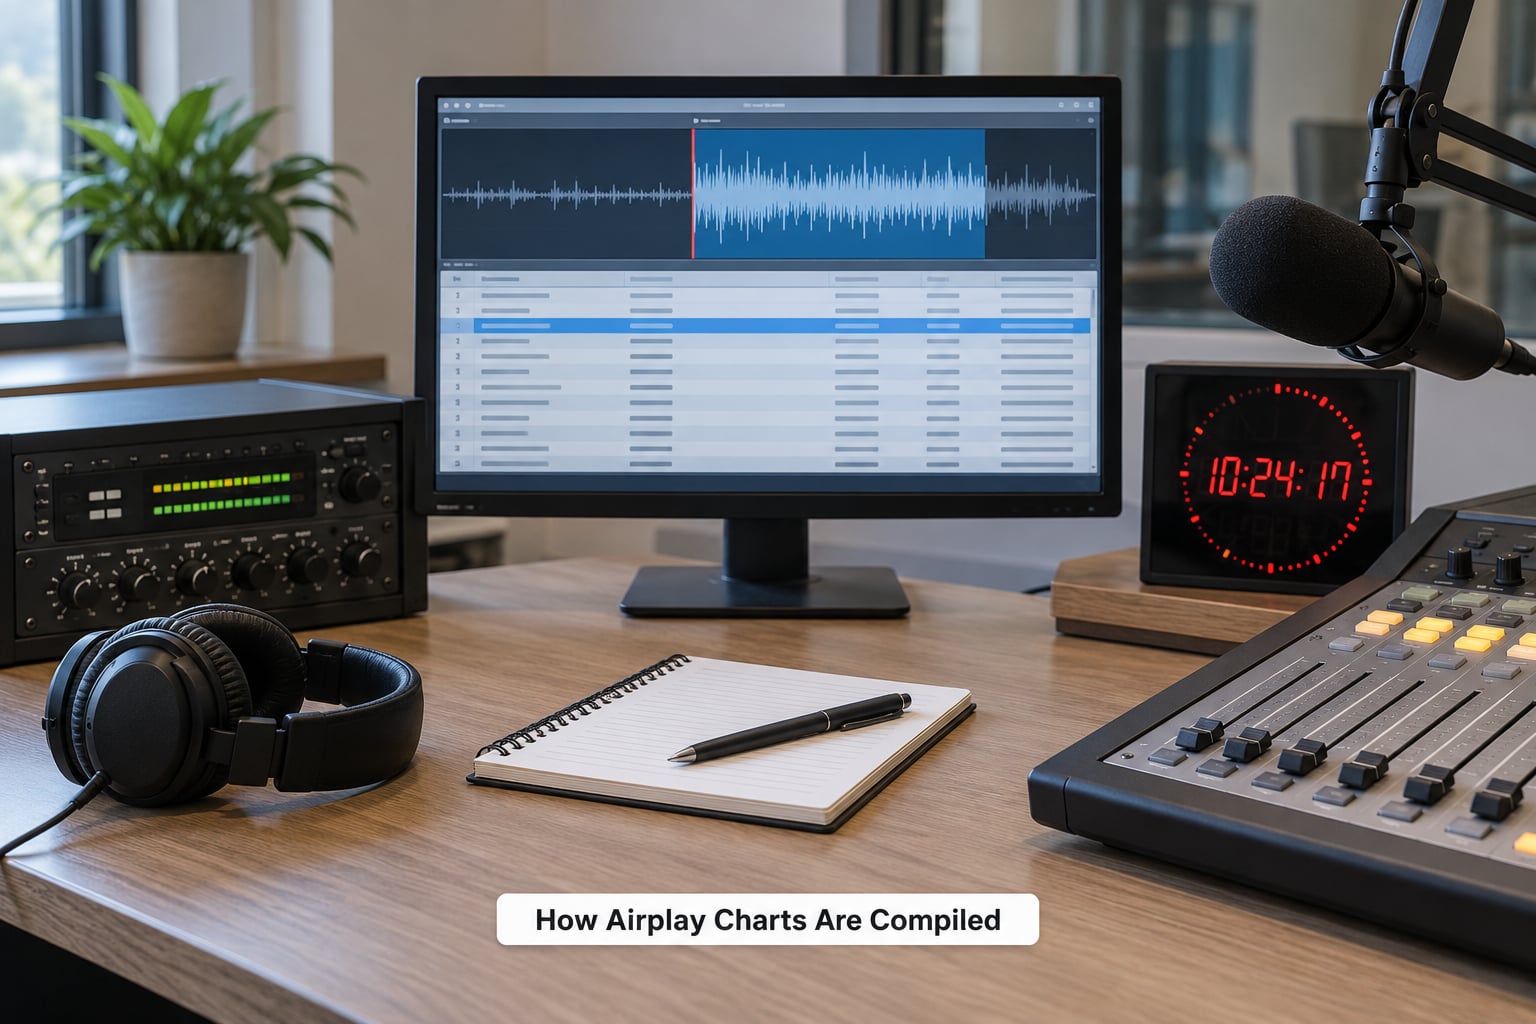
An airplay chart is a weekly ranking of songs based only on how many times a panel of monitored radio stations played them. Tracking systems such as Luminate (formerly Nielsen BDS) or Mediabase detect each completed play, log it as a spin, convert those spins into weighted audience impressions, and sort the totals at the end of a fixed tracking cycle.
The compilation itself has four moving parts. A station or stream signals that a song aired. A monitoring company verifies and counts it. A chart publisher applies format, market and eligibility rules to the result. A chart manager signs off before the list goes live.
Nothing in that chain is a vote or a survey of taste. That is the single most misunderstood thing about airplay charts: they are an audit trail of detected transmissions, not an opinion about which song is better.
What Counts as an Airplay?
A play counts when it is complete, detected and logged, not merely when someone hears it. Sitting in a drive-through for forty seconds of a track is a listen, not a charted airplay.
Monitoring systems apply a set of rules before anything reaches a chart. In broad terms, a play must run long enough to cover the majority of the recording. Repeats inside a short window are usually collapsed rather than counted as separate plays. A song skipped before the threshold does not register. And a station that goes off the air mid-song typically produces an incomplete detection.
There is also a distinction between a scheduled spin and a qualifying airplay. A station might play a song twelve times in a weekend, but if the monitoring rules or the chart’s format filters do not treat those plays as qualifying, none of them move the song.
Why station logs alone are not enough
A station’s own playlist log is a useful cross-check, but it is not the source of truth. Logs can be edited after the fact, software and traffic systems do not always sync, and a song played from an unexpected source may never reach the log at all. That gap is exactly why the industry moved away from station-reported counts decades ago and toward automatic signal monitoring.
How Stations Report What They Play: Pattern Matching and Logs
Most reporting stations run monitoring software supplied by the tracking company. The system learns a fingerprint of every track the station is licensed to play, then watches the outgoing audio signal for that fingerprint.
When a match runs long enough, the system records a detection with the time, the song, the duration of the play and the station’s market and format identifiers. In many cases the monitoring also draws on the station’s traffic and automation logs, which helps confirm that the play was scheduled rather than a stray feed from another source.
Two more layers sit behind that. Pattern-generated playlists are checked against the station’s music schedule for consistency, so an unexpected track can be flagged. And where there is any doubt, a chart analyst reviews the detection manually before it becomes eligible data.
Radio promoters and independent artists tend to treat that transparency as the thing that matters most. Discussion on industry forums keeps circling back to one point: a spin count attached to a named station in a named market is worth far more than a bare chart position, because you can act on it.
How Airplay Charts Are Compiled From Monitoring Data: Eight Steps
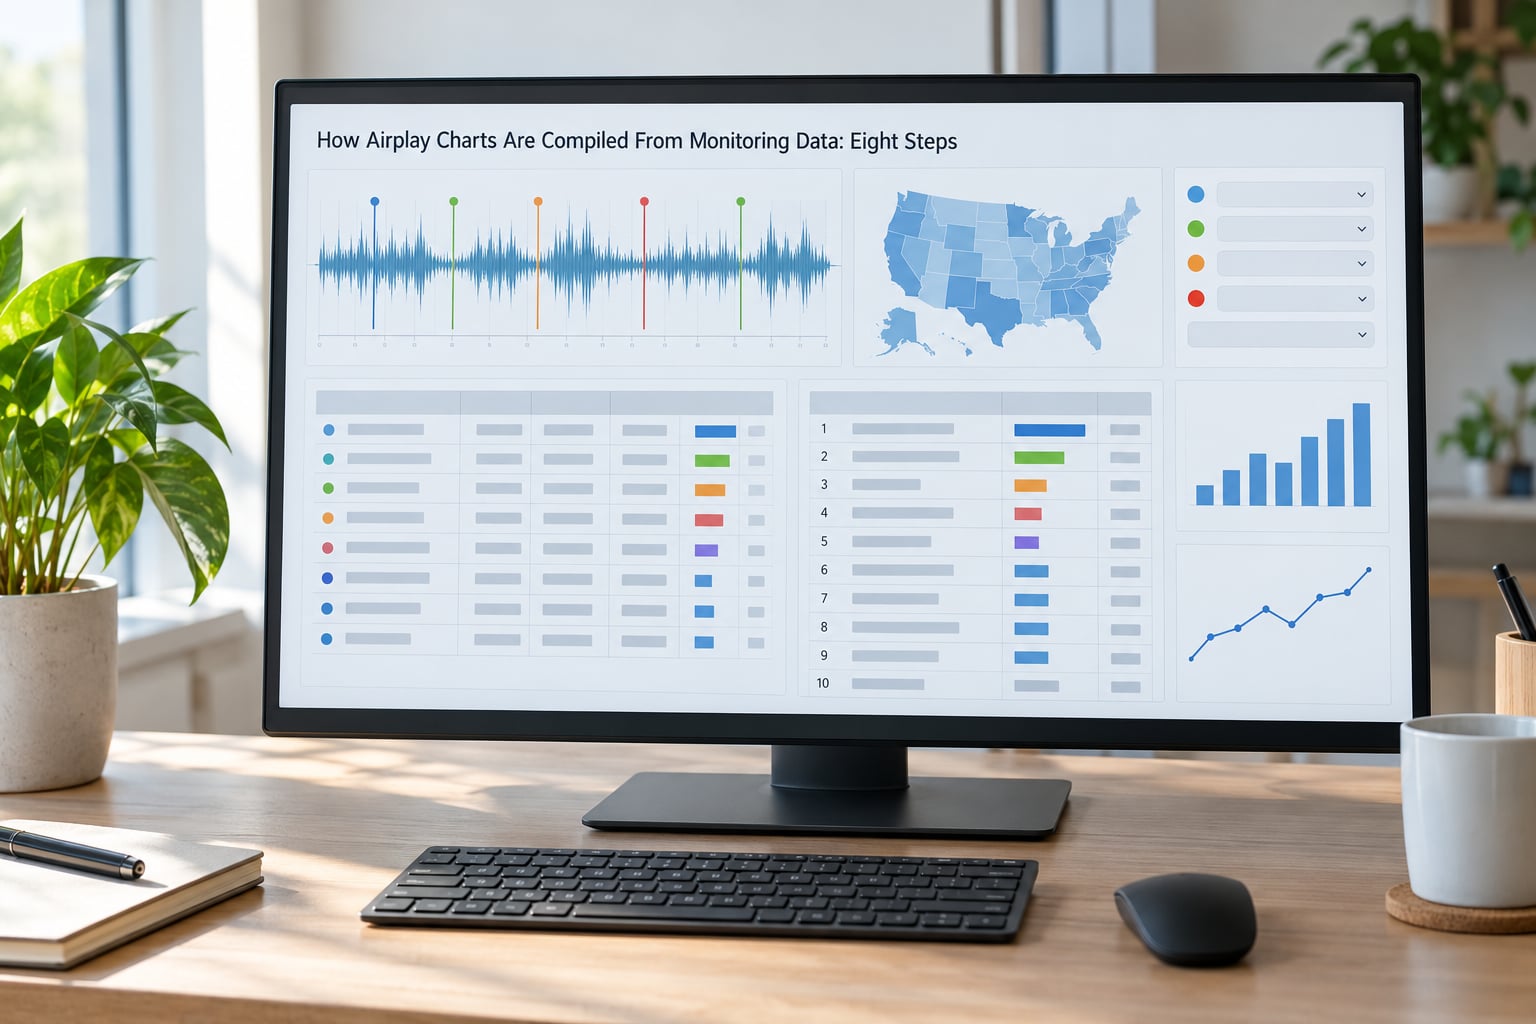
This is the part most searches are really asking about. Here is the sequence, from air to airplay chart position.
- The station’s software identifies the recording. A fingerprint of the track is created from a clean reference master, not from the station’s own copy, so compression artefacts do not break the match.
- The monitoring system watches the outgoing signal. It records each occurrence with a timestamp, the play duration and the station identifier.
- Routine rules clean the raw detections. Incomplete plays, repeats inside a defined window and detections that fail a manual review are removed or flagged.
- Qualified detections become spins. Each eligible play is tallied per station, per market and per format for the tracking week.
- Spins are weighted into audience impressions. A spin in a large market or from a station with a bigger audience counts for more than the same spin in a small market. Some charts publish raw spins, others publish impressions, which is one reason two airplay charts can disagree.
- Markets and formats are filtered. The tally is split by DMA, by format group such as CHR, AC, Country or Rhythmic, and by subscription services. A chart only counts the slice it is defined to cover.
- Eligibility rules are applied. A song must clear the chart’s detection threshold for enough reporting stations, and recurrent rules can move an ageing record off the main chart and onto a recurrent list.
- The results are calculated, reviewed and published. The chart manager checks for anomalies, publishes the ranking with arrows and weeks on chart, and dates the issue to the chart cycle.
A worked example: how spins become a rank
Take two songs over one tracking week. Song A gets 900 weighted impressions from 40 reporting stations. Song B gets 700 impressions from 55 stations.
On an impressions chart, Song A ranks above Song B, because weighted reach is the ranking unit. On a raw spins chart with a minimum-detection threshold, the outcome could flip: if many of Song A’s impressions come from a handful of high-weight markets while Song B’s plays are spread thin across more stations, Song B may clear the station-count threshold in more markets and rank higher.
That is not an error. It is two different definitions of “biggest” being applied to the same week of airplay, and it is the usual reason listeners see two charts disagreeing.
How Broadcast and Digital Listening Are Combined
Not every audio outlet feeds a chart the same way, and the differences are where a lot of confusion lives.
Over-the-air AM, FM and HD Radio simulcast feeds give the strongest, cleanest signal for detection. Internet-only streams are identified by a specific station identifier embedded in the stream, so the monitoring system knows exactly which station it is listening to and can apply the same complete-play rules.
Satellite and subscription services report through their own agreements with the tracking company, and their spins are usually counted separately rather than folded into local broadcast totals.
On-demand audio sits in a different category again. A listener pressing play on an album at home is a stream measured by a different system, and on-demand plays generally do not enter an airplay chart as spins. The exception is on-demand radio-style programming at some services, which can be monitored as a channel, but the rules differ by service and by agreement.
Radio plays do not quietly become streams. They are separate data streams feeding separate charts, which is why a song can be a radio giant and a streaming also-ran at the same time.
Why Market, Format, and Time Period Matter
A chart is defined by what it counts and when it counts it. Four common shapes cover most of what you will see published.
| Chart type | What it counts | Why results differ |
|---|---|---|
| National airplay chart | Weighted impressions from a panel across all monitored markets and formats | Large markets can dominate; small-market growth may barely register |
| Local or market chart | Spins from reporting stations inside one DMA | A song can lead one city and be absent from the national list entirely |
| Format chart | Only stations in a defined format group, such as Country or Adult Contemporary | Each format has its own panel, its own stations and its own add patterns |
| Multiweek or year-end chart | Accumulated totals across a full period | Recurrent rules and long tails behave differently over weeks than in one week |
One strong spin from a single large station group usually moves a chart less than dozens of small additions across many markets. Weighting exists precisely to stop one loud owner from dominating the list.
Where Sales and Streaming Data Fit
Airplay is one input among several, and the chart publisher decides which ones apply. Three data providers dominate: Luminate handles US audio monitoring and sales measurement, Mediabase supplies airplay data widely used for format and industry reporting, and the Official Charts Company compiles UK charts by combining official sales data with a panel of monitored airplay and streaming sources.
| Chart type | Inputs | What moves a song |
|---|---|---|
| Airplay-only chart | Monitored spins or weighted impressions | Radio exposure alone, regardless of sales |
| Combined chart | Sales, streaming and radio together | Any one of the three, with radio carrying less weight than it used to |
| Sales-only or streaming-only chart | Purchases or verified on-demand streams | Listener-initiated activity, with no radio element |
A publisher also sets position counts, chart size and how much weight each input carries. Those rules change over time as listening shifts, so a chart’s own published methodology is always the last word on how it works.
What Can—and Cannot—Change a Chart Position
What reliably moves a song: more stations adding it, more spins per station each week, and additions in markets where weighting is heaviest. A genuine acceleration across many small markets can beat a single big-market push, and that pattern is easy to spot in published weekly movers.
What sometimes moves it, and confuses people: recurrent rules, which move an ageing record off the main chart; a switch in tracking week, which can shift totals slightly; corrections when a station’s data is amended after publication; and reclassifications, when a song is recategorised into a different chart or format group.
What cannot be read from a chart: why a song rose. A chart reports what was detected, not whether a programmer liked it, whether a station was paid, or whether listeners skipped it. Anyone telling you a chart position proves quality, or proves a song was played because a label asked, is going beyond what the data can support.
Forum arguments about competing airplay charts usually reduce to this: one system counts spins, another counts weighted impressions, and the two answer slightly different questions about the same week of music.
Frequently Asked Questions
What is the difference between airplay and a chart ranking?
Airplay is a single detected play of a song by one station or stream during a tracking week. A chart ranking is the result of sorting every eligible song in a defined panel by that play data. One spin is an event; a position is a rank derived from thousands of spins, filtered by market and format rules and signed off by a chart manager.
How often are US radio airplay charts updated?
Most US radio airplay charts are published weekly, with data collected across a defined tracking cycle that runs Monday to Sunday. Some charts use a different window, so the week a number describes is not always the week it was published. Check the tracking dates printed with each chart, because comparing figures from different weeks is the fastest way to misread a result.
Why do local and national airplay charts show different results?
A local chart counts only the reporting stations inside one market, while a national chart pools the whole panel and weights spins by audience. A song can dominate a mid-sized city and sit low nationally, or lead the national list while barely registering on a city chart. Market weighting and panel coverage are the two biggest reasons for the gap.
Does heavy radio rotation guarantee a song will rank highly?
No. Heavy rotation at one station or one ownership group produces far less chart movement than modest rotation spread across dozens of stations in many markets. Weighting, format eligibility and minimum station-detection thresholds all matter. A song with a hundred spins concentrated in a few heavy markets can lose to one with fewer spins distributed widely.
Can a song have more spins but a lower chart position?
Yes, and it is more common than people expect. It happens when one chart ranks by raw spins and another by weighted audience impressions, when the panels differ, when tracking weeks are offset, or when recurrent rules move a long-running record onto a separate list. Compare like with like before concluding that a chart is wrong.
How do chart companies verify that stations reported accurately?
Automated monitoring does most of the work. Pattern-matched software fingerprints each recording, flags incomplete or repeated plays, and cross-checks detections against station traffic and automation logs. Anything ambiguous goes to a human analyst, and the results are recalculated and reviewed by a chart manager before publication. Stations that transmit data directly rather than relying on signal detection are audited separately.
Conclusion
Airplay charts are compiled in a fixed order every cycle: a monitored station plays a song, software detects a complete transmission, the play is counted as a spin, spins are weighted by market and format, eligibility rules are applied, and a chart manager publishes the ranked result.
Before you read any chart position, identify the exact chart and its tracking week. Spins versus impressions, national versus local, airplay-only versus combined, weekly versus year-end — each answers a different question. Once you know which one you are looking at, the numbers finally make sense.